Gold futuresGC=F
4,341.1+62.65%range price changes
OLIVIA / MARKET RESEARCH
I'm Olivia, Portfolio Analyst.
Support the investment team's judgment through investment research, portfolio analysis and risk assessment.
Observation period
2025-01-02 — 2025-12-31
CROSS-ASSET MONITOR
Price performance of gold, US dollar and equity index, as well as 10-year US Treasury yield. The whole year of 2025 is aligned according to comparable trading days to avoid misaligned comparisons.
Gold futuresGC=F
4,341.1S&P 500 FuturesES=F
6,892.5U.S. dollar indexDX-Y.NYB
98.2810-year U.S. bond^TNX
4.16%First day of range = 100 · Closing price indexPrice return methodology, excluding cash flow and costs
Swipe left or right to view the complete chart and coordinates →
FEATURED RESEARCH / GOLD FUTURES
From a candlestick to an evidence-based market assessment.
Swipe left or right to view the complete chart and coordinates →
Move the pointer or touch the candlestick to view the current day's market. After focusing on the chart, you can use the ← → key to switch. The moving average is the closing average of the last 5 available trading days.
PRICE ACTION REVIEW
It reached a high of 4,250.0 on November 13 and closed back to 4,094.2 the next day; it reached a high of 4,263.1 on November 28 and closed at 4,254.9. The last day of the range closed above 4,250. Whether that level holds requires observations beyond this period.
Can the close above the resistance zone be sustained? Has the support zone been tested again? Does volume support price changes?These are research questions, not backtested trading signals.
Compare range highs and lows, describe dips, rallies, and tests, and avoid inferring trend reversals from a single candlestick.
Trading volume comes from futures prices. An increase in transactions indicates active trading, and neither buyer nor seller funds can be identified individually.
The observation period is from 2025-09-02 to 2025-11-28, a total of 63 trading days. This code is the Gold futures market sequence, not spot XAU/USD. Contract switching may affect continuity. Areas, connections, and stages are annotated for post-mortem research on this page.
Download OHLCV ↓A corresponds to the high point on October 20; B corresponds to the drawdown low point on October 28; C corresponds to the end of the range on November 28. Support and resistance are marked by subjective research and are not statistically verified results.
| Date | Open | High | Low | Close | Volume |
|---|---|---|---|---|---|
| 2025-09-02 | 3517.9 | 3602.4 | 3506 | 3592.2 | 374,141 |
| 2025-09-03 | 3600 | 3640.1 | 3592.4 | 3635.5 | 220,786 |
| 2025-09-04 | 3619.8 | 3621.6 | 3573.7 | 3606.7 | 232,579 |
| 2025-09-05 | 3602 | 3655.5 | 3595.4 | 3653.3 | 237,651 |
| 2025-09-08 | 3635 | 3685.7 | 3621.7 | 3677.4 | 227,640 |
| 2025-09-09 | 3676.6 | 3715.2 | 3663.7 | 3682.2 | 262,656 |
| 2025-09-10 | 3662 | 3697.5 | 3651.4 | 3682 | 182,028 |
| 2025-09-11 | 3680.6 | 3687.5 | 3651 | 3673.6 | 214,612 |
| 2025-09-12 | 3672.8 | 3695.5 | 3667.3 | 3686.4 | 154,559 |
| 2025-09-15 | 3680.2 | 3724.9 | 3662.8 | 3719 | 189,452 |
| 2025-09-16 | 3720.3 | 3739.9 | 3711.8 | 3725.1 | 192,295 |
| 2025-09-17 | 3727.3 | 3744 | 3679.5 | 3717.8 | 256,047 |
| 2025-09-18 | 3692.5 | 3707.3 | 3660.5 | 3678.3 | 224,128 |
| 2025-09-19 | 3677.7 | 3719.6 | 3664.4 | 3705.8 | 186,954 |
| 2025-09-22 | 3721.3 | 3783.3 | 3718.1 | 3775.1 | 219,170 |
| 2025-09-23 | 3781.2 | 3824.6 | 3772.4 | 3815.7 | 291,564 |
| 2025-09-24 | 3796.9 | 3812.6 | 3749.7 | 3768.1 | 236,560 |
| 2025-09-25 | 3768.3 | 3792.3 | 3751.9 | 3771.1 | 262,183 |
| 2025-09-26 | 3781.5 | 3814.4 | 3764 | 3809 | 214,083 |
| 2025-09-29 | 3788.8 | 3863.7 | 3785.5 | 3855.2 | 258,145 |
| 2025-09-30 | 3863.1 | 3899.2 | 3820.6 | 3873.2 | 312,257 |
| 2025-10-01 | 3887.7 | 3922.7 | 3880.3 | 3897.5 | 290,470 |
| 2025-10-02 | 3892.7 | 3923.3 | 3842.8 | 3868.1 | 284,217 |
| 2025-10-03 | 3880.4 | 3916.8 | 3861.1 | 3908.9 | 218,284 |
| 2025-10-06 | 3913.5 | 3994.5 | 3909.2 | 3976.3 | 278,143 |
| 2025-10-07 | 3983 | 4014.6 | 3963.4 | 4004.4 | 297,512 |
| 2025-10-08 | 4007.1 | 4081 | 4005.6 | 4070.5 | 348,778 |
| 2025-10-09 | 4061.8 | 4077.9 | 3957.9 | 3972.6 | 461,023 |
| 2025-10-10 | 3990.1 | 4038.6 | 3961.2 | 4000.4 | 357,542 |
| 2025-10-13 | 4018.3 | 4137.2 | 4011.3 | 4133 | 357,542 |
| 2025-10-14 | 4130.9 | 4190.9 | 4105 | 4163.4 | 405,991 |
| 2025-10-15 | 4160.1 | 4235.8 | 4157.3 | 4201.6 | 309,914 |
| 2025-10-16 | 4225.1 | 4346.7 | 4214.5 | 4304.6 | 375,196 |
| 2025-10-17 | 4348.1 | 4392 | 4196 | 4213.3 | 569,847 |
| 2025-10-20 | 4269 | 4398 | 4229.7 | 4359.4 | 338,235 |
| 2025-10-21 | 4371 | 4393.6 | 4093 | 4109.1 | 535,325 |
| 2025-10-22 | 4137 | 4175 | 4021.2 | 4065.4 | 468,711 |
| 2025-10-23 | 4114.8 | 4171.5 | 4079.6 | 4145.6 | 271,973 |
| 2025-10-24 | 4144 | 4159 | 4055.7 | 4137.8 | 297,599 |
| 2025-10-27 | 4103.2 | 4123.8 | 3985.9 | 4019.7 | 330,749 |
| 2025-10-28 | 3999.9 | 4034.2 | 3901.3 | 3983.1 | 338,428 |
| 2025-10-29 | 3967.2 | 4046.2 | 3930 | 4000.7 | 288,266 |
| 2025-10-30 | 3942.8 | 4041.5 | 3925.1 | 4015.9 | 246,321 |
| 2025-10-31 | 4038.2 | 4059.9 | 3982.3 | 3996.5 | 237,172 |
| 2025-11-03 | 4001 | 4043.1 | 3971.3 | 4014 | 0 |
| 2025-11-04 | 4013.7 | 4018 | 3937.1 | 3960.5 | 250,259 |
| 2025-11-05 | 3939.5 | 4000.7 | 3935.7 | 3992.9 | 175,161 |
| 2025-11-06 | 3992.4 | 4028.7 | 3973.2 | 3991 | 188,688 |
| 2025-11-07 | 3986.9 | 4035.8 | 3981.6 | 4009.8 | 208,649 |
| 2025-11-10 | 4007.2 | 4124 | 4004.2 | 4122 | 253,812 |
| 2025-11-11 | 4124 | 4155 | 4102.8 | 4116.3 | 252,249 |
| 2025-11-12 | 4132.2 | 4218.5 | 4104.4 | 4213.6 | 296,796 |
| 2025-11-13 | 4202.4 | 4250 | 4148.5 | 4194.5 | 319,216 |
| 2025-11-14 | 4174.9 | 4215.1 | 4032.6 | 4094.2 | 342,176 |
| 2025-11-17 | 4084.4 | 4107.6 | 4006.8 | 4074.5 | 235,352 |
| 2025-11-18 | 4045.6 | 4083.7 | 3997.4 | 4066.5 | 233,302 |
| 2025-11-19 | 4067.8 | 4134.3 | 4055.6 | 4082.8 | 233,696 |
| 2025-11-20 | 4079.9 | 4109.6 | 4034 | 4060 | 272,355 |
| 2025-11-21 | 4074.9 | 4101 | 4018.1 | 4079.5 | 257,813 |
| 2025-11-24 | 4069.2 | 4138.2 | 4036.4 | 4094.2 | 223,055 |
| 2025-11-25 | 4133.5 | 4156.3 | 4106.7 | 4140 | 132,704 |
| 2025-11-26 | 4128.6 | 4171 | 4127.5 | 4165.2 | 25,088 |
| 2025-11-28 | 4198.6 | 4263.1 | 4174.6 | 4254.9 | 154,806 |
SCENARIO RISK
Scenario Net Profit and Loss
-$5,100.00Gold futures · long · Price changes -5.00%| Price changes | Net profit and loss · USD |
|---|---|
| -10% | -$10,100.00 |
| -5% | -$5,100.00 |
| 0% | -$100.00 |
| 5% | $4,900.00 |
| 10% | $9,900.00 |
Net Profit and Loss = Nominal Exposure × Price Change Rate × Directional Coefficient − Total Round Trip Cost. A linear USD exposure model is used; margin, options, exchange rates and funding costs need to be modeled separately. Scenario values are determined by the input.
SELECTED RESEARCH
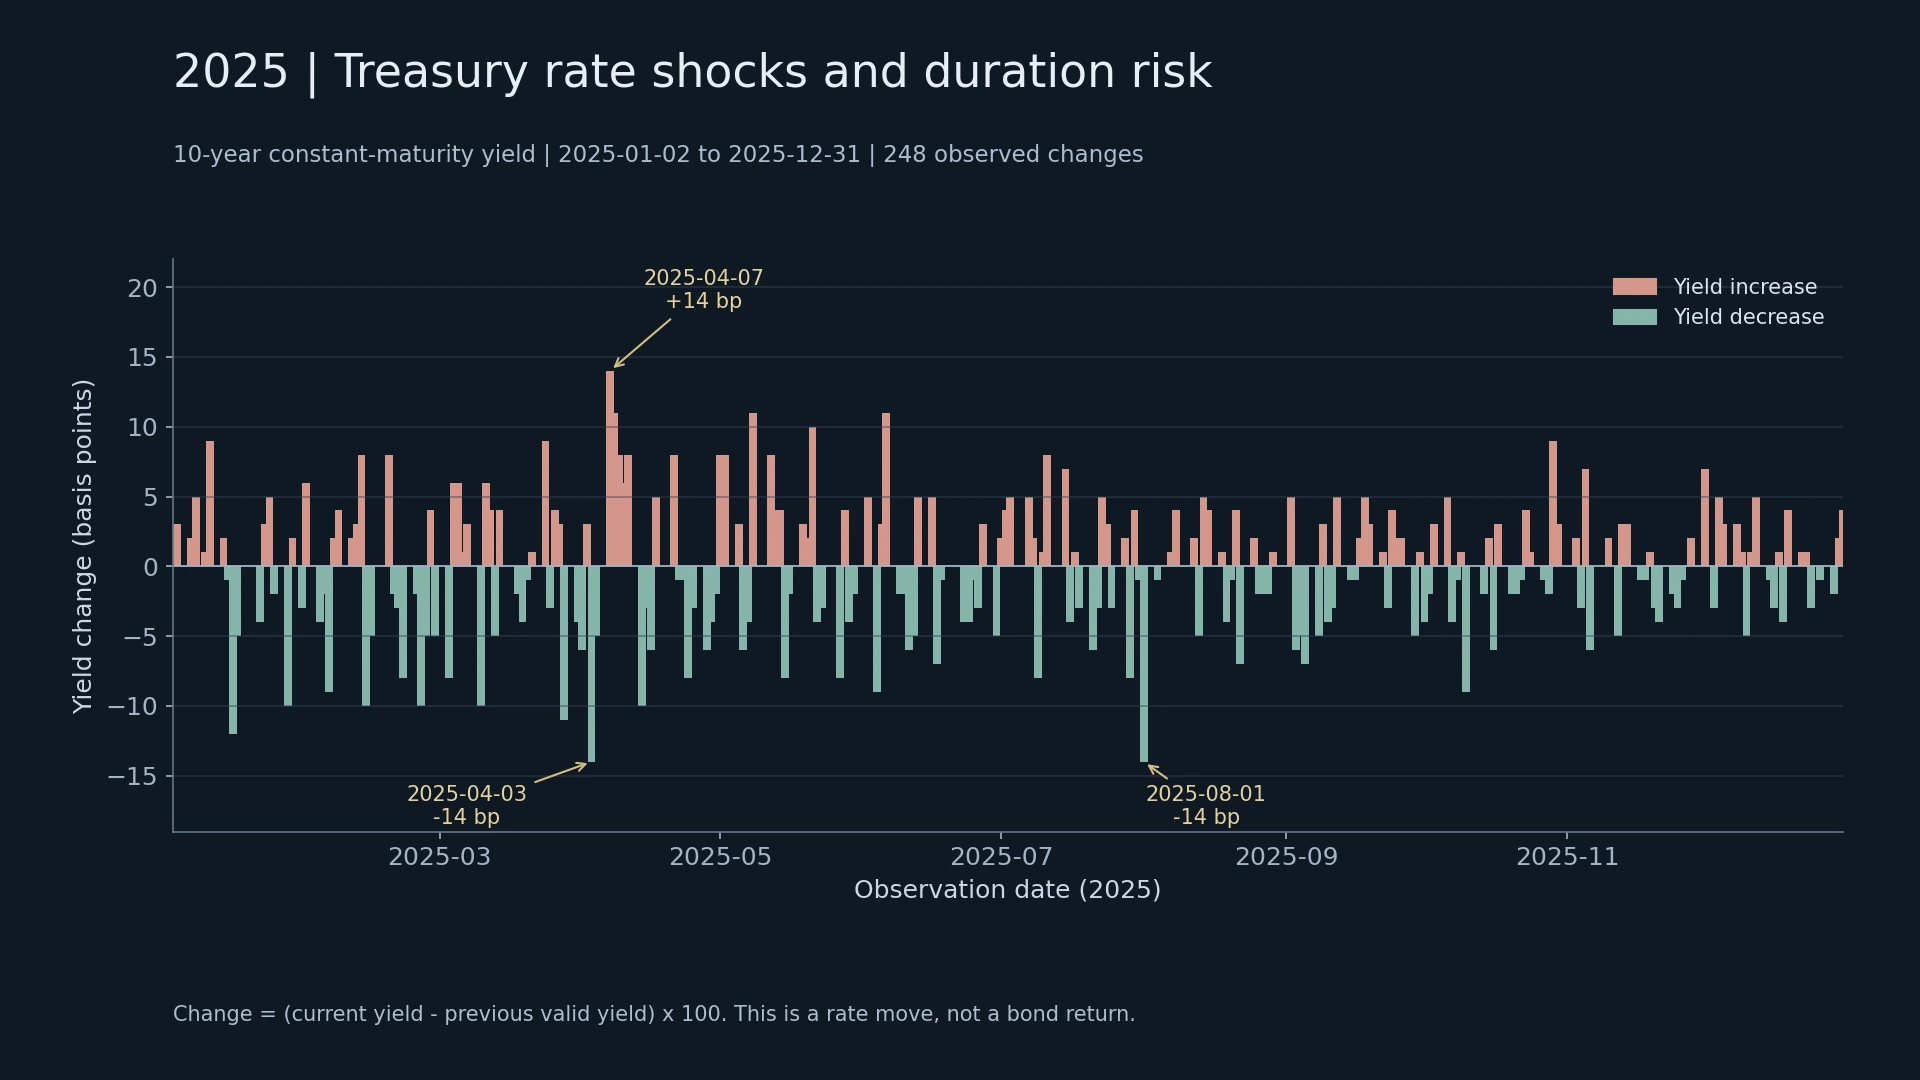
Using real government bond auction prices as the anchor point, we analyze cash flow revaluation under duration, convexity and interest rate shocks.
Read the research →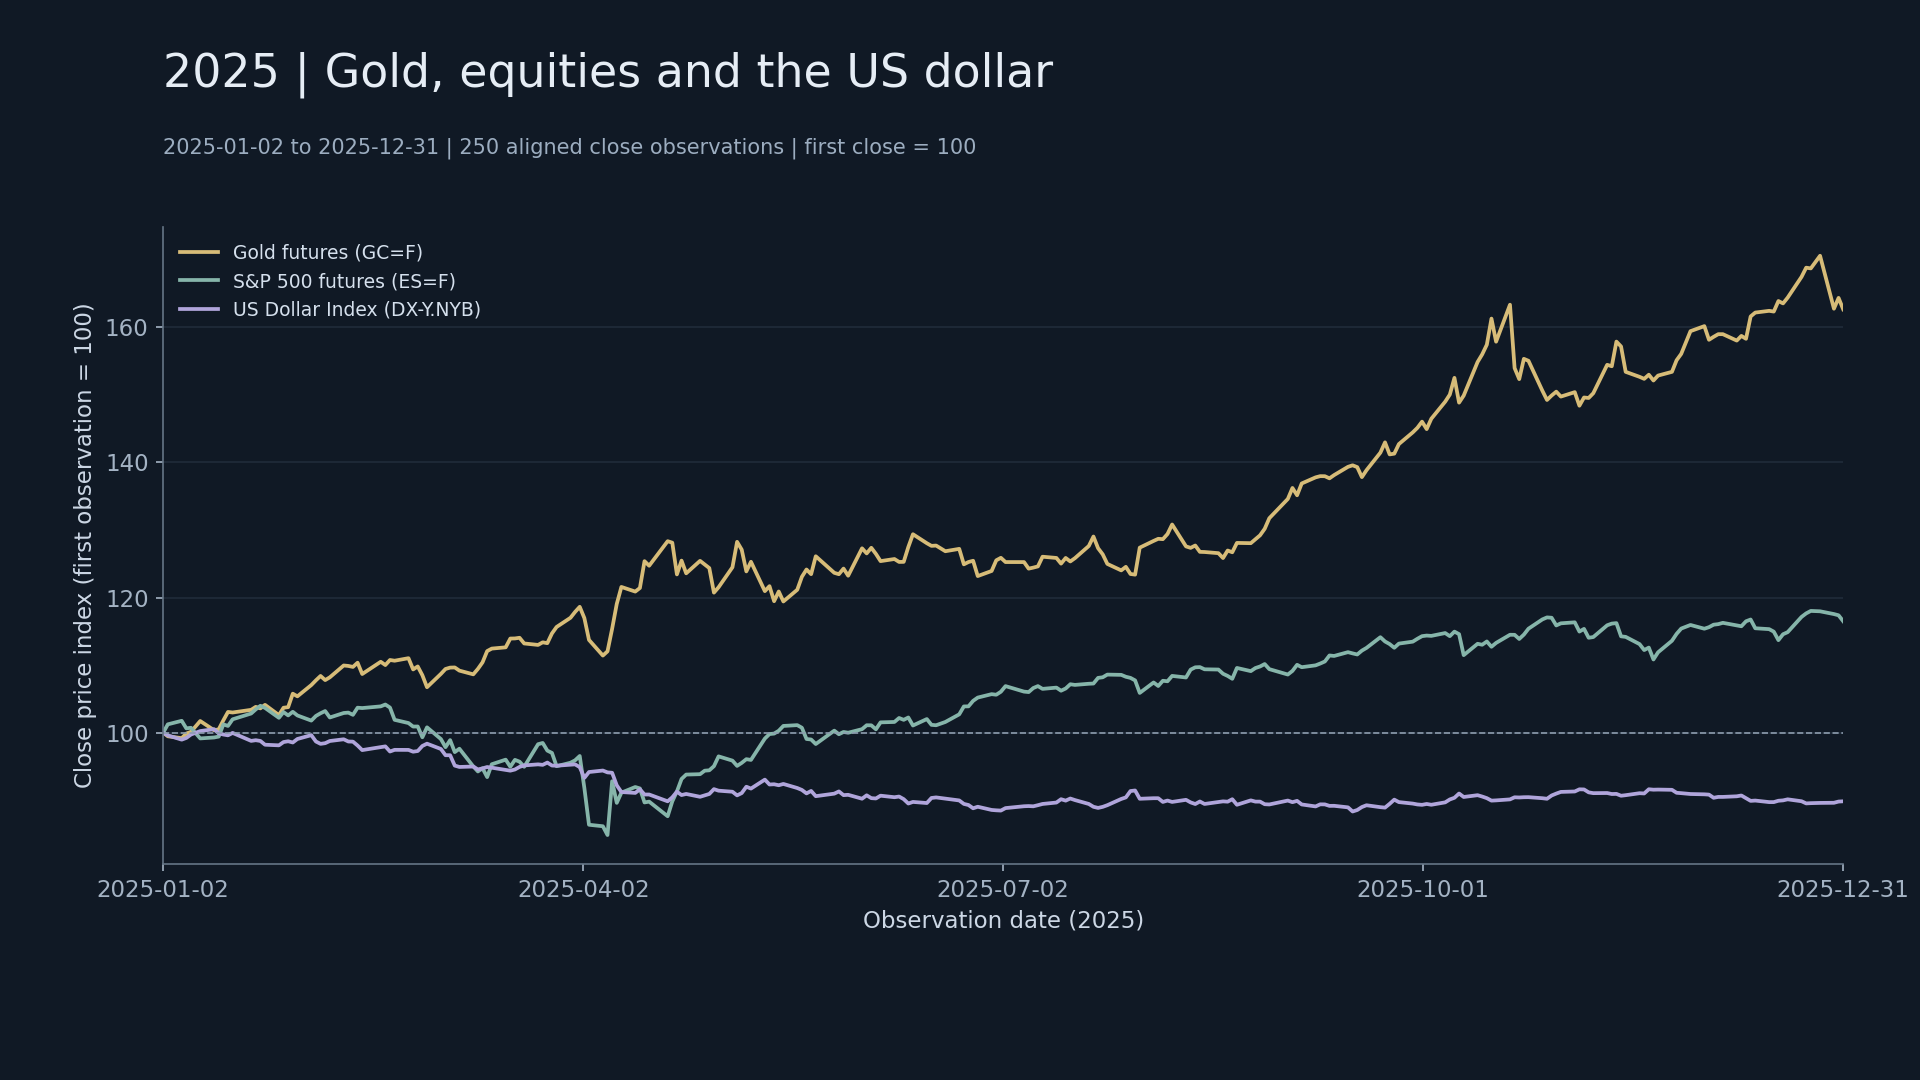
Align market trading days to compare price changes, volatility and correlations, and examine common changes in stress periods.
Read the research →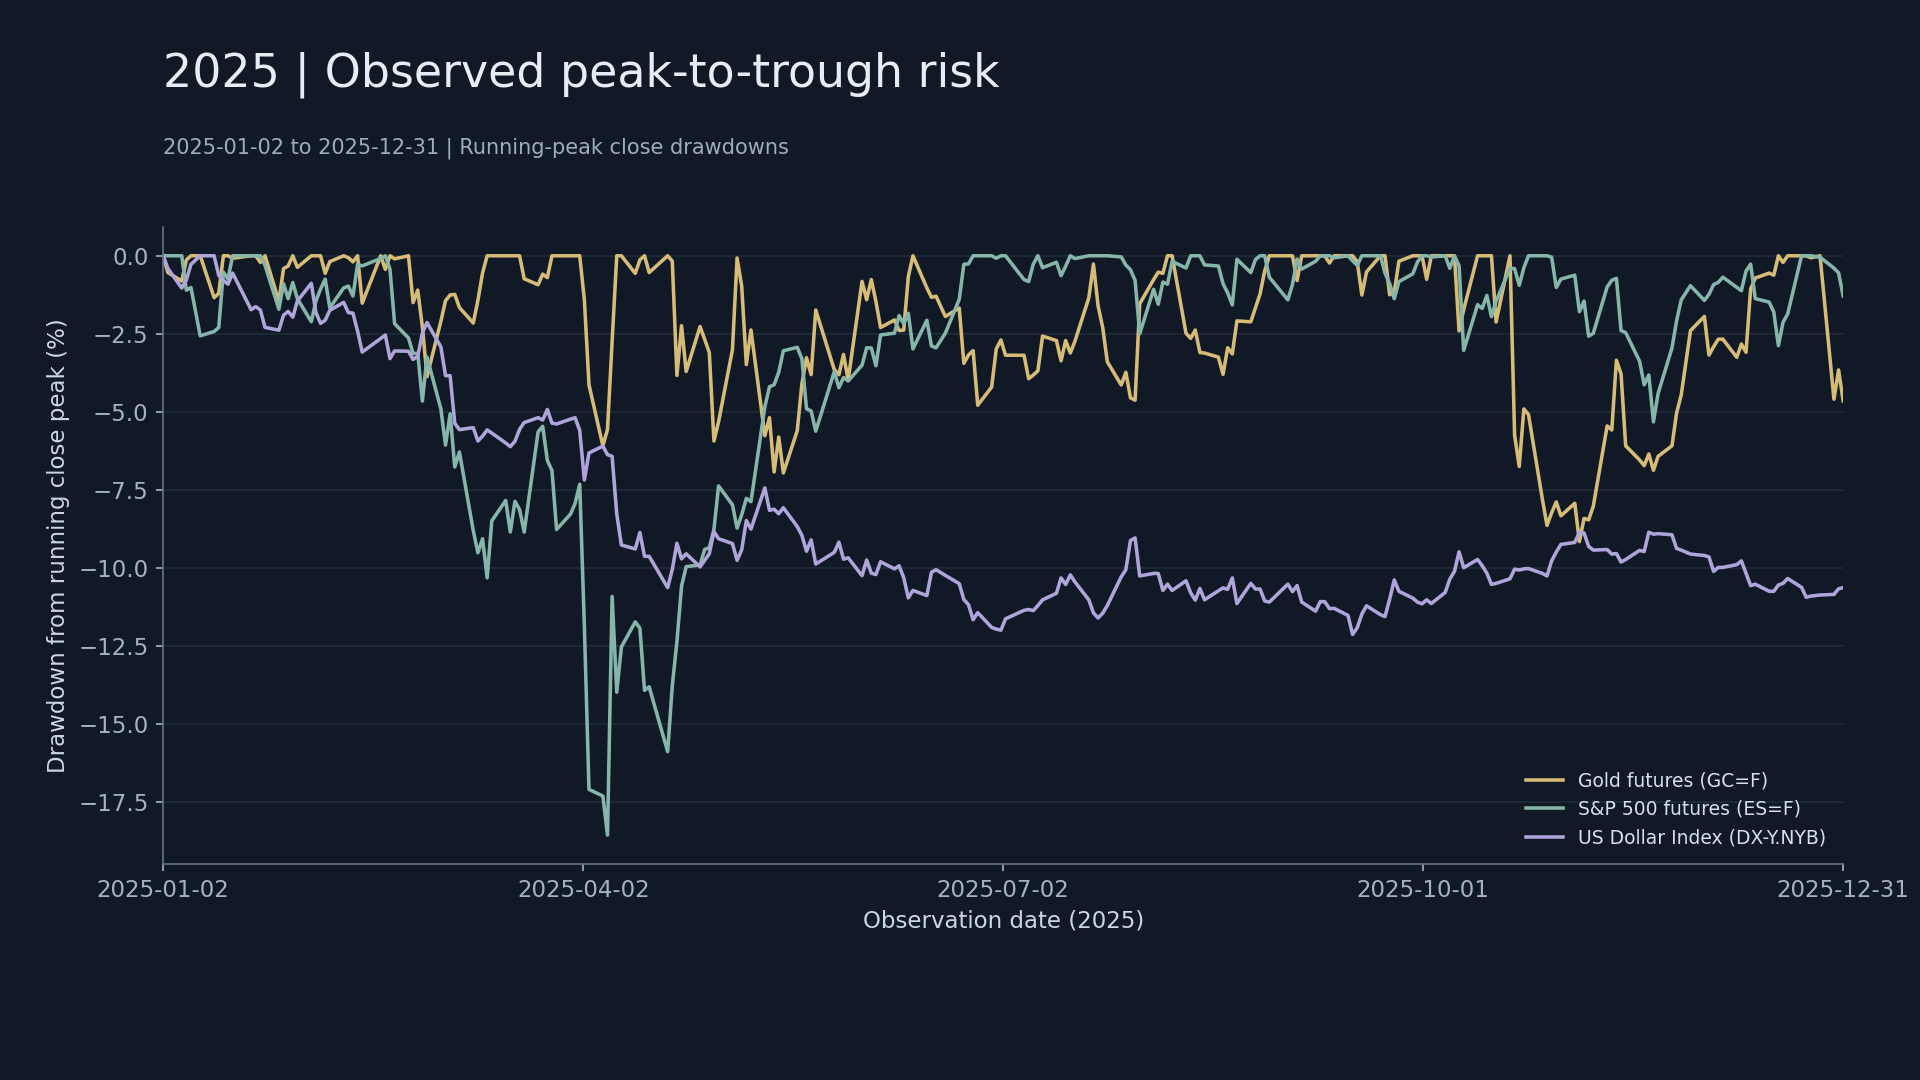
The historical risk is measured based on the actual closing drawdown in 2025, and the amount under different price scenarios is calculated based on the nominal exposure.
Read the research →TOOLS & WORKFLOW
Read the closing price and treasury bond yield, retain the original code and observation period.
Take the intersection by date to calculate price returns, sample volatility and correlation. Exported data can be reviewed in Excel.
Interpret observations using price structure markers, convert nominal exposures to amounts, and document validation conditions.