ResearchPrepared: January 2026

2025 Bond duration and interest rate risk: from real shocks to DV01

Research conclusion

Duration management needs to answer two questions at the same time: how much interest rate changes actually occur in the market, and how much the same change will cost a certain bond exposure. The benchmark yield on the 10-year U.S. Treasury note fell from 4.57% to 4.18% in 2025, a drop of 39 bp at the beginning and end of the year; however, there was still a single rise of +14 bp in the adjacent valid trading days, and the drop in interest rates at the end of the year cannot cover up the market value risk during the period. Taking the real Treasury bond 91282CLW9 auctioned in January 2025 as an example, the benchmark yield is 4.680%, and the calculated modified duration is approximately 7.86 years. The DV01 per $1 million face value is approximately $765.42. When the yield rises by 50 bp, the fully repriced dirty price changes by about -3.84%; this result is a risk scenario on a fixed settlement date, not the actual position return.

1. Research objects and scope of evidence

This report combines both types of evidence. The first category is the yield data for 249 trading days, which is used to describe the market interest rate level in 2025 and 248 adjacent changes. The second category is the Treasury bond auction results, which are used to determine the true terms and valuation anchor of a single bond. The benchmark constant-maturity yield is not the daily quote for this bond, and the two are not mixed.
True Bond TermsOfficial Records
Issuer / CUSIPU.S. Department of the Treasury / 91282CLW9
Coupon / Interest payment frequency4.25% / Interest payment semi-annually
Auction Date / Settlement Date2025-01-07 / 2025-01-15
Expiration date2034-11-15
The highest accepted yield in the auction4.680%
Official clean price / face value per 10096.631098
Official accrued interest / per 1,000 face value$7.16160
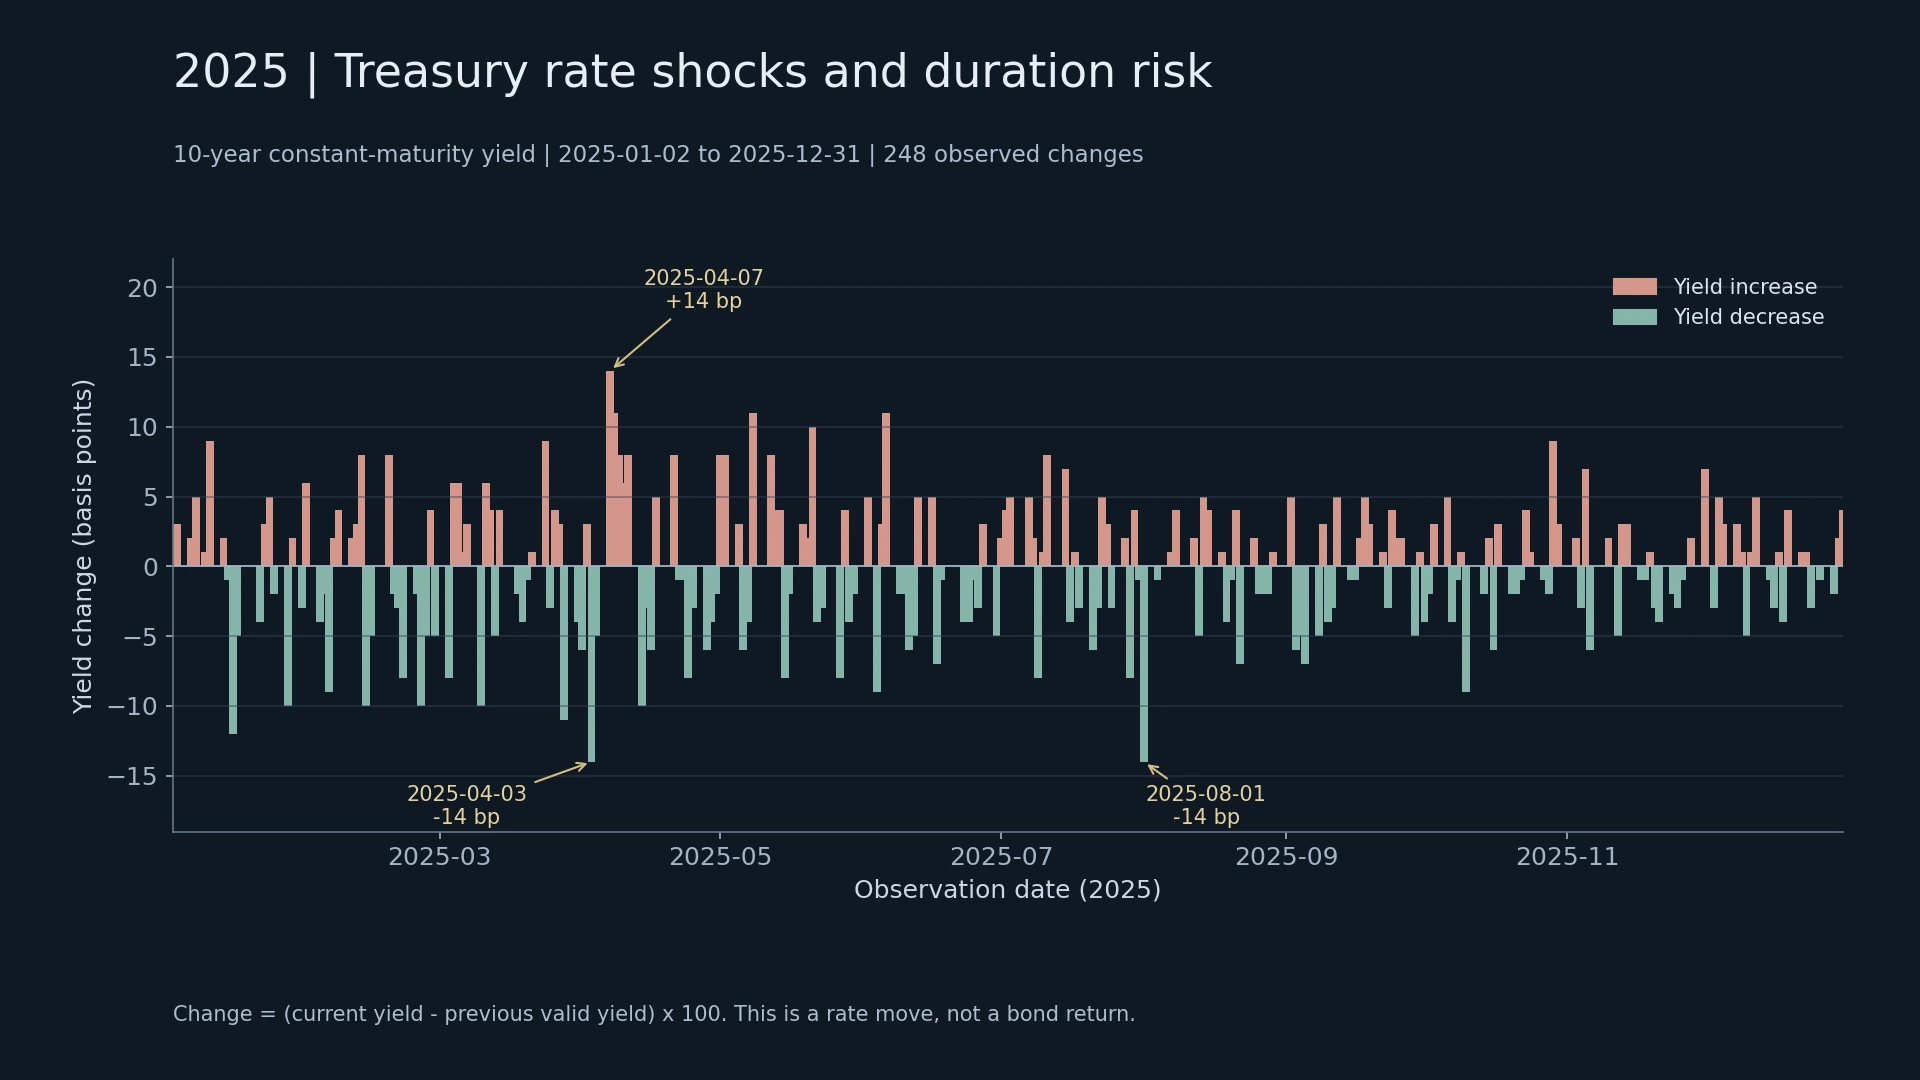
Download interest rate data CSV · View large image of interest rate shock chart

2. Impact on real interest rates in 2025

The cover column chart uses adjacent differences of actual yields, with bp on the vertical axis, and positive values ​​indicate rising yields. For long bonds with fixed cash flows, this direction corresponds to downward price pressure, other things being equal. 1 bp equals 0.01 percentage points; the difference between 4.15% and 4.01% is 14 bp, not a 14% return on investment.
Observation dateDGS10 yieldChange from the previous valid trading day
2025-04-034.06%-14 bp
2025-04-074.15%+14 bp
2025-08-014.23%-14 bp
2025-01-154.66%-12 bp
2025-03-284.27%-11 bp
The above table selects the first five trading days based on the absolute value of changes; the same range is sorted by date. No zeros will be filled for missing holidays, and changes across weekends will not be forcibly interpreted as a natural day impact. The sample is used to characterize the historical scale of change without making claims about the probability of the next shock or directly attributing fluctuations on a given day to a single piece of news.

3. Review the price from cash flow

The semi-annual coupon is $2.125 per 100 face value, with 20 remaining interest payments and an additional 100 principal repayment in the final installment. Settled on 2025-01-15, the last interest payment date is 2024-11-15, and the next interest payment date is 2025-05-15; the complete coupon period is 181 days, 61 days have passed, and it is 120 days until the next interest payment. Accrued interest is 2.125 × 61 / 181 = 0.716160. The cash flow is discounted based on the pricing of the short first coupon period issued by the U.S. Treasury, resulting in a dirty price of 97.347258, and the clean price after subtracting accrued interest is 96.631097. The difference between the result and the official clean price 96.631098 is less than 0.00001 per 100 face value, and the difference comes from the published accuracy. The first half-year period is discounted using simple interest, and the remaining full half-year period is discounted using compound interest. The clean price is used for quotation, and the dirty price includes accrued interest; the following percentage sensitivities use dirty price as the denominator to avoid mixing quotation methodology and cash value.

4. Correct duration, convexity and DV01

IndicatorsCalculation results of this caseExplanation
Modified duration7.8628 yearsLocal first-order price sensitivity corresponding to changes in yields
convexity74.0560 years²Describes the degree of curvature in the relationship between price and yield
DV01 / per 100 par$0.076542First order loss margin for 1 bp upside in yield
DV01 / face value per 1 millionUSD 765.42Linearly amplified by face value, does not represent actual position
The first-order relationship is ΔP / P ≈ −modified duration × Δy; after adding convexity, it is ΔP / P ≈ −modified duration × Δy + 0.5 × convexity × Δy². Use decimals for Δy in the formula, 0.005 should be entered for 50 bp. DV01 is dirty price × modified duration × 0.0001. Duration and convexity come from the first-order and second-order yield derivatives of the same cash flow pricing function, and are cross-checked with bilateral small shock revaluation. Duration is not equal to the remaining maturity period; this bond has an intermediate coupon and cash flow collection is earlier than the final maturity date.

5. Interest rate scenarios and approximation errors

Fix the settlement date, coupon, residual cash flow, and accrued interest, and change only the yield to maturity. The clean price in the table is the scenario revaluation of the cash flow model, not the historical transaction price on different dates. Percentages are calculated relative to the base dirty price.
Interest rate shockRevaluation clean priceComplete revaluation changeDuration approximation onlyDuration+convexity approximation
-100 bp104.6584+8.25%+7.86%+8.23%
-50 bp100.5499+4.03%+3.93%+4.02%
+0 bp96.6311+0.00%0.00%+0.00%
+50 bp92.8926-3.84%-3.93%-3.84%
+100 bp89.3254-7.50%-7.86%-7.49%
Under large impacts, linear duration alone will miss convexity. For this ordinary fixed-rate bond, the price changes produced by interest rate cuts and interest rate increases of the same absolute magnitude are not symmetrical. Adding convexity is closer to a full repricing, but larger shocks, embedded option features or changes in cash flows should still warrant a direct revaluation. Download scenario calculation sheet · View input, formula conventions and indicators

6. How to transform into portfolio risk judgment

Assuming a face value of US$1 million, the benchmark dirty price market value is approximately US$973,472.58; the revaluation amount change for a 50 bp increase in yield is -US$37,385.13. This amount is calculated at the sample face value and the actual amount at risk varies with exposure. At the portfolio level, the valuation date and yield convention should be unified first, DV01 with direction should be calculated on a bond-by-bond basis, and then long and short exposures should be combined. The same total DV01 does not mean the same risk: positions concentrated at the short end or the long end may have different profits and losses when the curve changes non-parallel, so key rate duration, maturity-bucket shocks and complete cash flow revaluation are also required. The hedging ratio needs to be calculated based on specific instruments and positions. Implementing futures hedging requires contract DV01, the cheapest deliverable bond, conversion factor and basis; judging whether the risk exceeds the limit requires real risk budget, liquidity constraints and capital costs. When this information is missing, only sensitivities and assumptions are reported, and it cannot be claimed that the hedge has been effective or that risk limits have been met.

7. Conclusion boundaries and subsequent testing

Historical interest rate changes, auction facts and model scenarios belong to different levels. DGS10 is a constant-maturity benchmark, not a full-year return series for fixed CUSIP; this case does not reconstruct the full-year total bond return, nor does it include coupon reinvestment during the holding period, financing costs, transaction costs, or bid-ask spreads. Yield shocks assume other things remain unchanged. If you are studying corporate bonds, mortgage-backed securities or bonds with embedded options, you should also include the effective duration after adjustments for credit spreads, prepayments and options. The next step is to expand the risk on a bond-by-bond basis based on actual positions and market quotes, and test the yield curve shifts for different periods. You cannot directly apply a duration value in this example to the entire portfolio. Observation period is 2025, Prepared: January 2026. The downloaded file retains historical data, calculation inputs and scenario results, and can be independently recalculated; neither historical performance nor scenario sensitivity constitutes a commitment to future returns.

Related analysis projects

2025 Multi-asset allocation research: returns, correlations and risk diversification

2025 Multi-asset allocation research: returns, correlations and risk diversification

Compare the full sample and short-term correlation, test the cross-asset performance of the equity index during the stress period, and clarify the applicable boundaries of the allocation conclusion.
2025 actual drawdown vs. scenario amounts

2025 actual drawdown vs. scenario amounts

Identify actual peaks and valleys and recovery dates, analyze drawdown recovery requirements, and measure nominal exposure, account equity, and scenario gains and losses separately.
2025 U.S. Treasury Yields: Changes in Short-End and Long-End

2025 U.S. Treasury Yields: Changes in Short-End and Long-End

Compare short-term and long-term yield levels on a quarterly basis and distinguish the different impacts of interest rate direction, yield curve shifts and cash flow valuation.