ResearchPrepared: January 2026

2025 Multi-asset allocation research: returns, correlations and risk diversification

Key findings

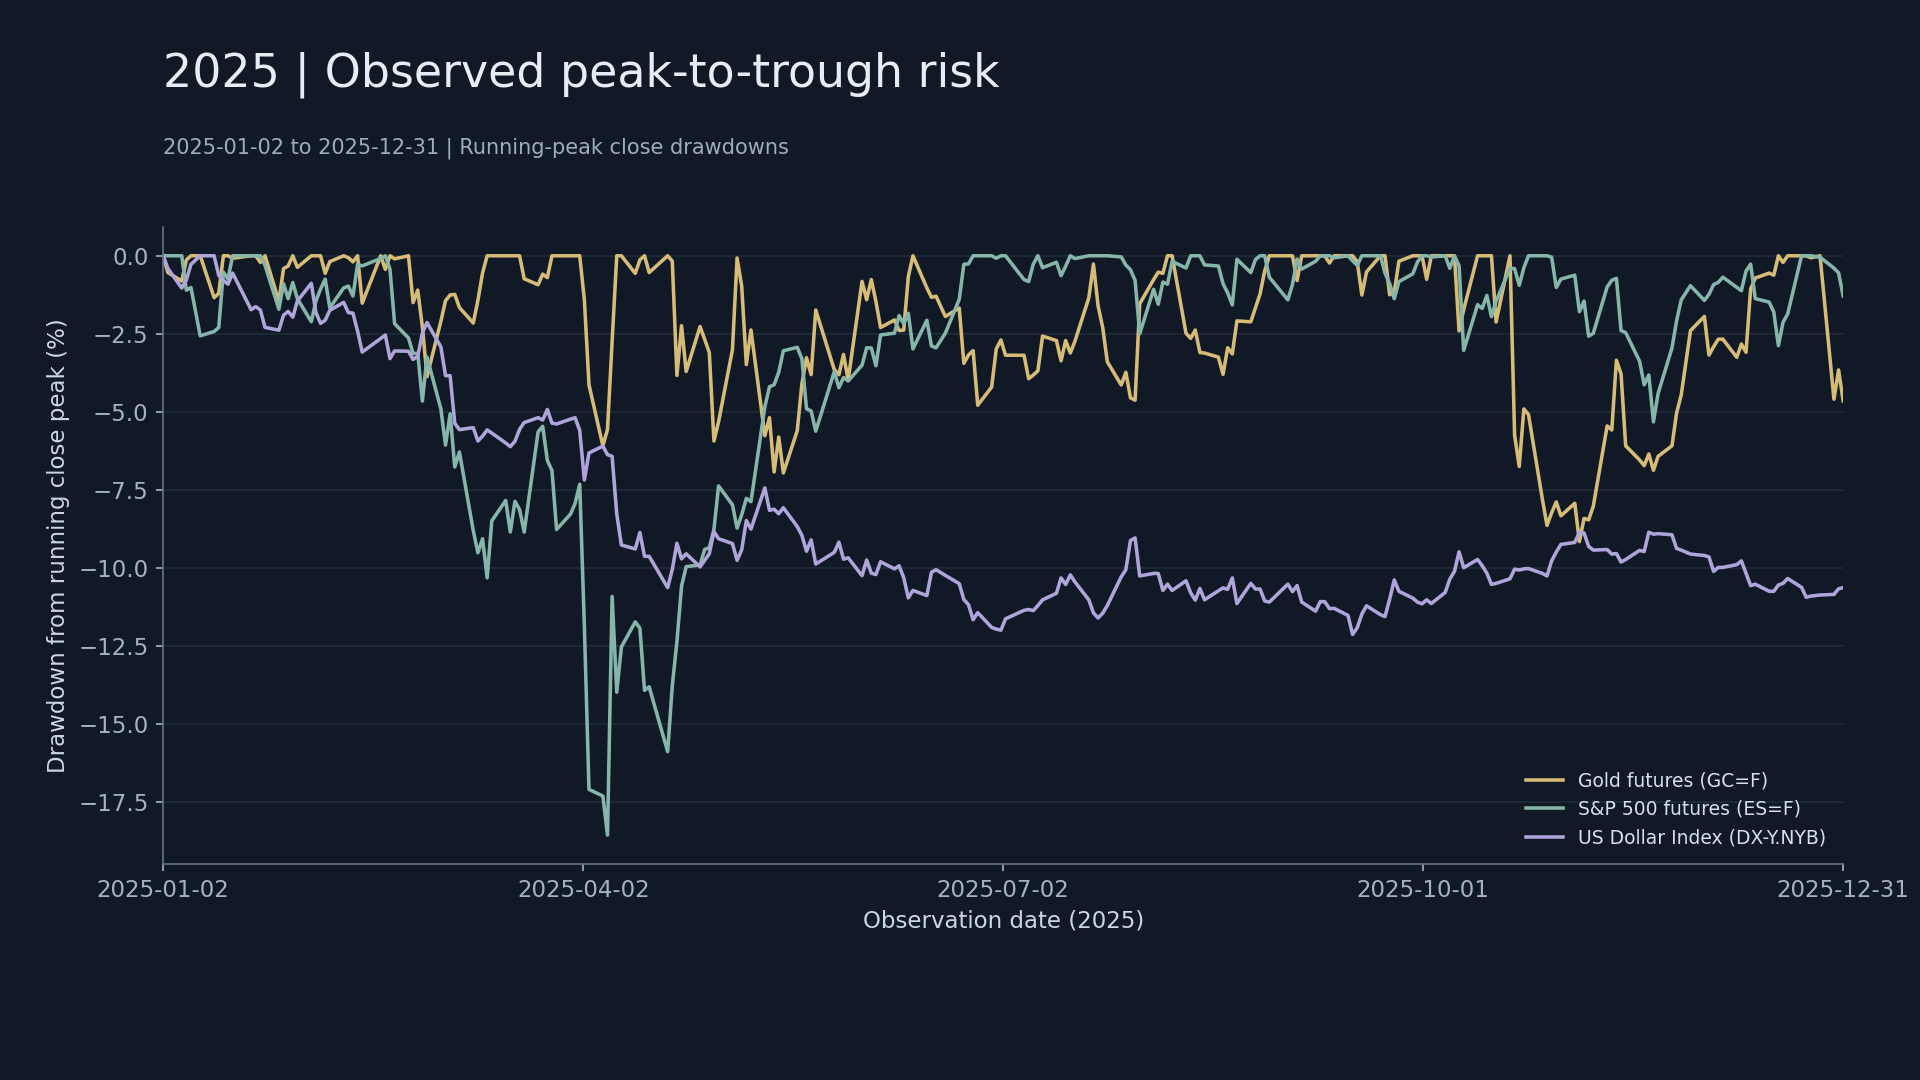
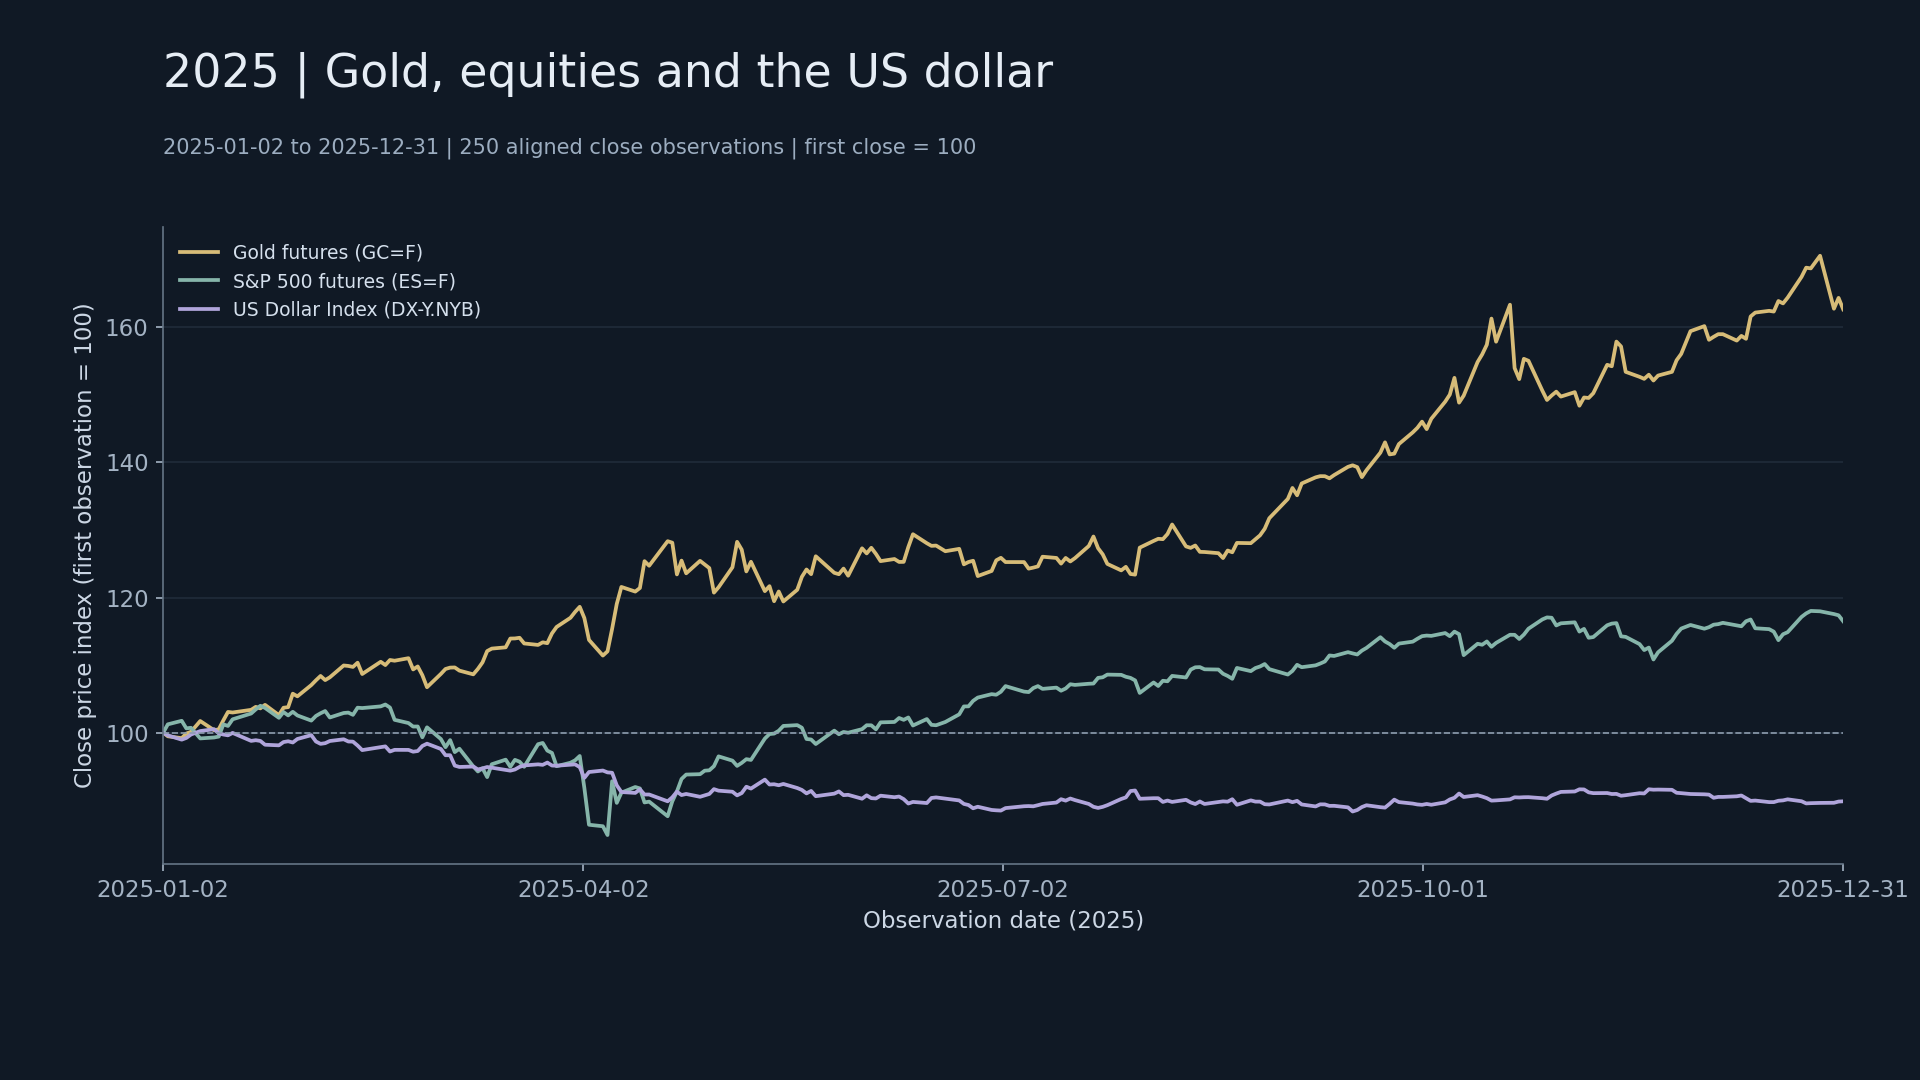
This study examines whether the risks of different assets are truly complementary, rather than just comparing who rose the most throughout the year. In the common sample in 2025, Gold futures prices increased the most, but the maximum closing drawdown of equity index futures was deeper. Therefore, allocation judgment requires observing the changes in returns, volatility, drawdown and stress periods at the same time, and the best-performing asset cannot be directly equated to the optimal portfolio.

Observation period

From 2025-01-02 to 2025-12-31, the four series are aligned by comparable trading days, and 250 observations are retained. Gold and equity index use the futures series GC=F, ES=F, and the US dollar uses DX-Y.NYB; ^TNX is the Cboe 10-year U.S. Treasury yield indicator, in percentage. Interactive Market Observation · Download Data

Results

MarketObservation period price changesAnnualized sample volatilityMaximum closing drawdown
Gold Futures+62.65%20.99%-9.15%
S&P 500 Futures+16.50%19.08%-18.54%
U.S. Dollar Index-10.16%7.44%-12.12%
In this observation period, gold rose, the equity index rose, and the U.S. U.S. dollar index fell. ^TNX changed from 4.575% to 4.163%, a change of -41.2 bp. Changes in yield levels cannot be considered as returns on bond investments.

Calculation methodology

The price curve is shown with the closing price of the first comparable trading days at 100. The return is the closing price at the end of the period / the closing price at the beginning of the period - 1; the volatility is the simple return sample standard deviation multiplied by √252; drawdown is the change from the previous closing peak. Price changes in the annual statistical range do not include price changes from the end of the previous year to the first day of the range, nor do they include cash flow, rollover income and costs.

Research Questions and Comparable Ranges

Comparisons are made to Gold futures, S&P 500 futures and the U.S. U.S. dollar index; the 10-year yield is viewed separately as a backdrop for interest rates. The first three are measured as price changes, and interest rates are measured in percentage points and bp. Normalizing to 100 unifies the starting point of the graph, which does not unify the risks, nor does it mean that the three assets require equal weight allocation. This report did not obtain cash returns, continuous futures month-to-month trading, financing and portfolio weight data, so the net worth or Sharpe ratio of the executable strategy cannot yet be calculated. The conclusions here are used to form a list of research hypotheses and risks and cannot replace backtesting of executable portfolios.

Full sample and short-term correlation

Correlation is based on closing price returns on adjacent comparable trading days, rather than price levels; the latter can be misleading due to common trends. There are 249 observations of returns in the full-year sample, and 20 observations in the short sample at the end of the observation period.
PortfolioFull sample Pearson rLast 20 observations Pearson r
Gold Futures/USD Index-0.410-0.208
Gold Futures / S&P 500 Futures0.0210.296
U.S. Dollar Index / S&P 500 Futures0.128-0.508
The correlation coefficient between gold and equity index for the whole year is 0.021, while the correlation coefficient between the last 20 observations is 0.296; the relationship between the US dollar and equity index has changed from 0.128 in the full sample to -0.508 in the short term. Sample selection will change the risk diversification judgment, and the relationship in the last month or so cannot be extrapolated into a long-term stable relationship. A correlation close to zero only indicates a weak linear relationship, but does not mean independence in extreme scenarios; a negative correlation does not guarantee protection on every down day.

Equity stress days: did other assets provide protection?

The following selects the five adjacent trading day data with the worst equity index futures returns in this sample to compare changes in other assets on the same date. Selection criteria are fixed before looking at other asset results to avoid singling out only dates that support the “risk-off” narrative.
DateChanges in equity index futuresChanges in Gold futuresChanges in U.S. U.S. dollar index
2025-04-04-5.94%-2.76%+0.93%
2025-04-03-4.89%-1.41%-1.68%
2025-04-10-3.44%+3.19%-1.97%
2025-10-10-2.71%+0.70%-0.56%
2025-03-10-2.69%-0.50%+0.07%
These five sets of data are not all stress scenarios, nor can they be used to estimate disaster loss probabilities; they provide a more direct test: the asset's full-year performance and its protection ability during stress are different issues. If allocation options need to be formed, continuous pressure windows, rolling correlations and funding requirements should be further examined rather than relying solely on a full-year price chart.

From market observation to asset allocation

First determine the base currency, investable instruments, risk budget and rebalancing frequency, and then use actual tradable returns to estimate covariance and risk contribution. Assets with smaller weights but greater volatility may still dominate portfolio risk; conversely, close nominal amounts do not mean the same risk occupancy. This study does not give “optimal weights” in the absence of investment constraints. If the portfolio data is subsequently obtained, the fixed weight and risk budget plans can be compared, and drawdown, turnover and risk contribution can be tested under the same transaction costs, cash returns and sample observation periods. It is necessary to retain independent samples or rolling samples to reduce reliance on the market conditions of a single year.

Conclusion and boundaries

The three sequences in 2025 have different return and drawdown paths, which has the value of continuing to study risk diversification. But “multi-asset” itself is not a risk control: common liquidity shocks, leverage and margin calls can turn different assets into sources of cash demand simultaneously. Research should be carried out to positions and cash flows, rather than stopping at the correlation coefficient table. View original price comparison chart · Control risk drawdown study Download common date data. The futures quotation sequence may be affected by the change of months, and price changes are not equal to the investment return including rollover, cash flow and costs. Prepared: January 2026. Download study computational abstract.

Related analysis projects

2025 Term Spread: Change Path and Observation Boundary

2025 Term Spread: Change Path and Observation Boundary

Split the contribution of the long and short ends to the term spread, analyze the different sources of curve steepening, and distinguish between portfolio risk and bank net interest margin.
2025 actual drawdown vs. scenario amounts

2025 actual drawdown vs. scenario amounts

Identify actual peaks and valleys and recovery dates, analyze drawdown recovery requirements, and measure nominal exposure, account equity, and scenario gains and losses separately.
2025 U.S. Treasury Yields: Changes in Short-End and Long-End

2025 U.S. Treasury Yields: Changes in Short-End and Long-End

Compare short-term and long-term yield levels on a quarterly basis and distinguish the different impacts of interest rate direction, yield curve shifts and cash flow valuation.