Research JournalPrepared:January 20262025 Term Structure: Spread Paths and Explanatory Boundaries
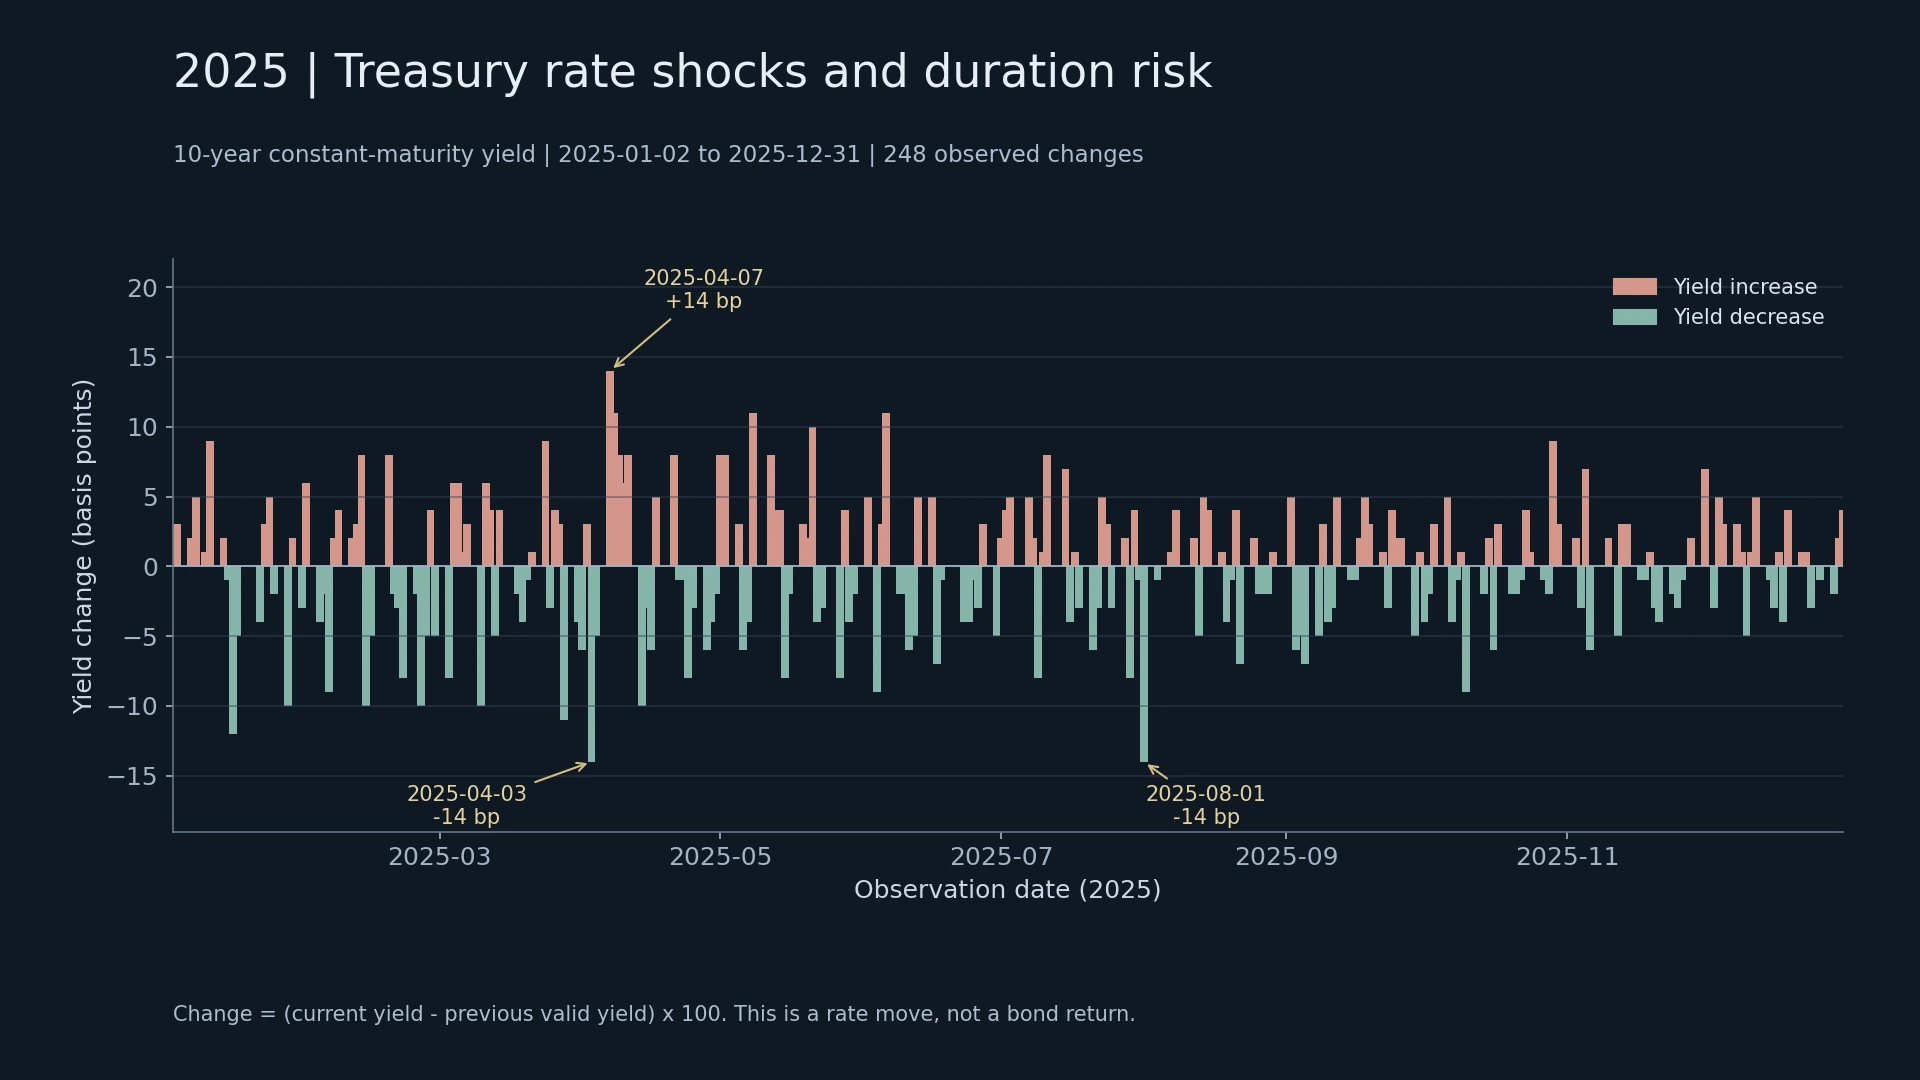
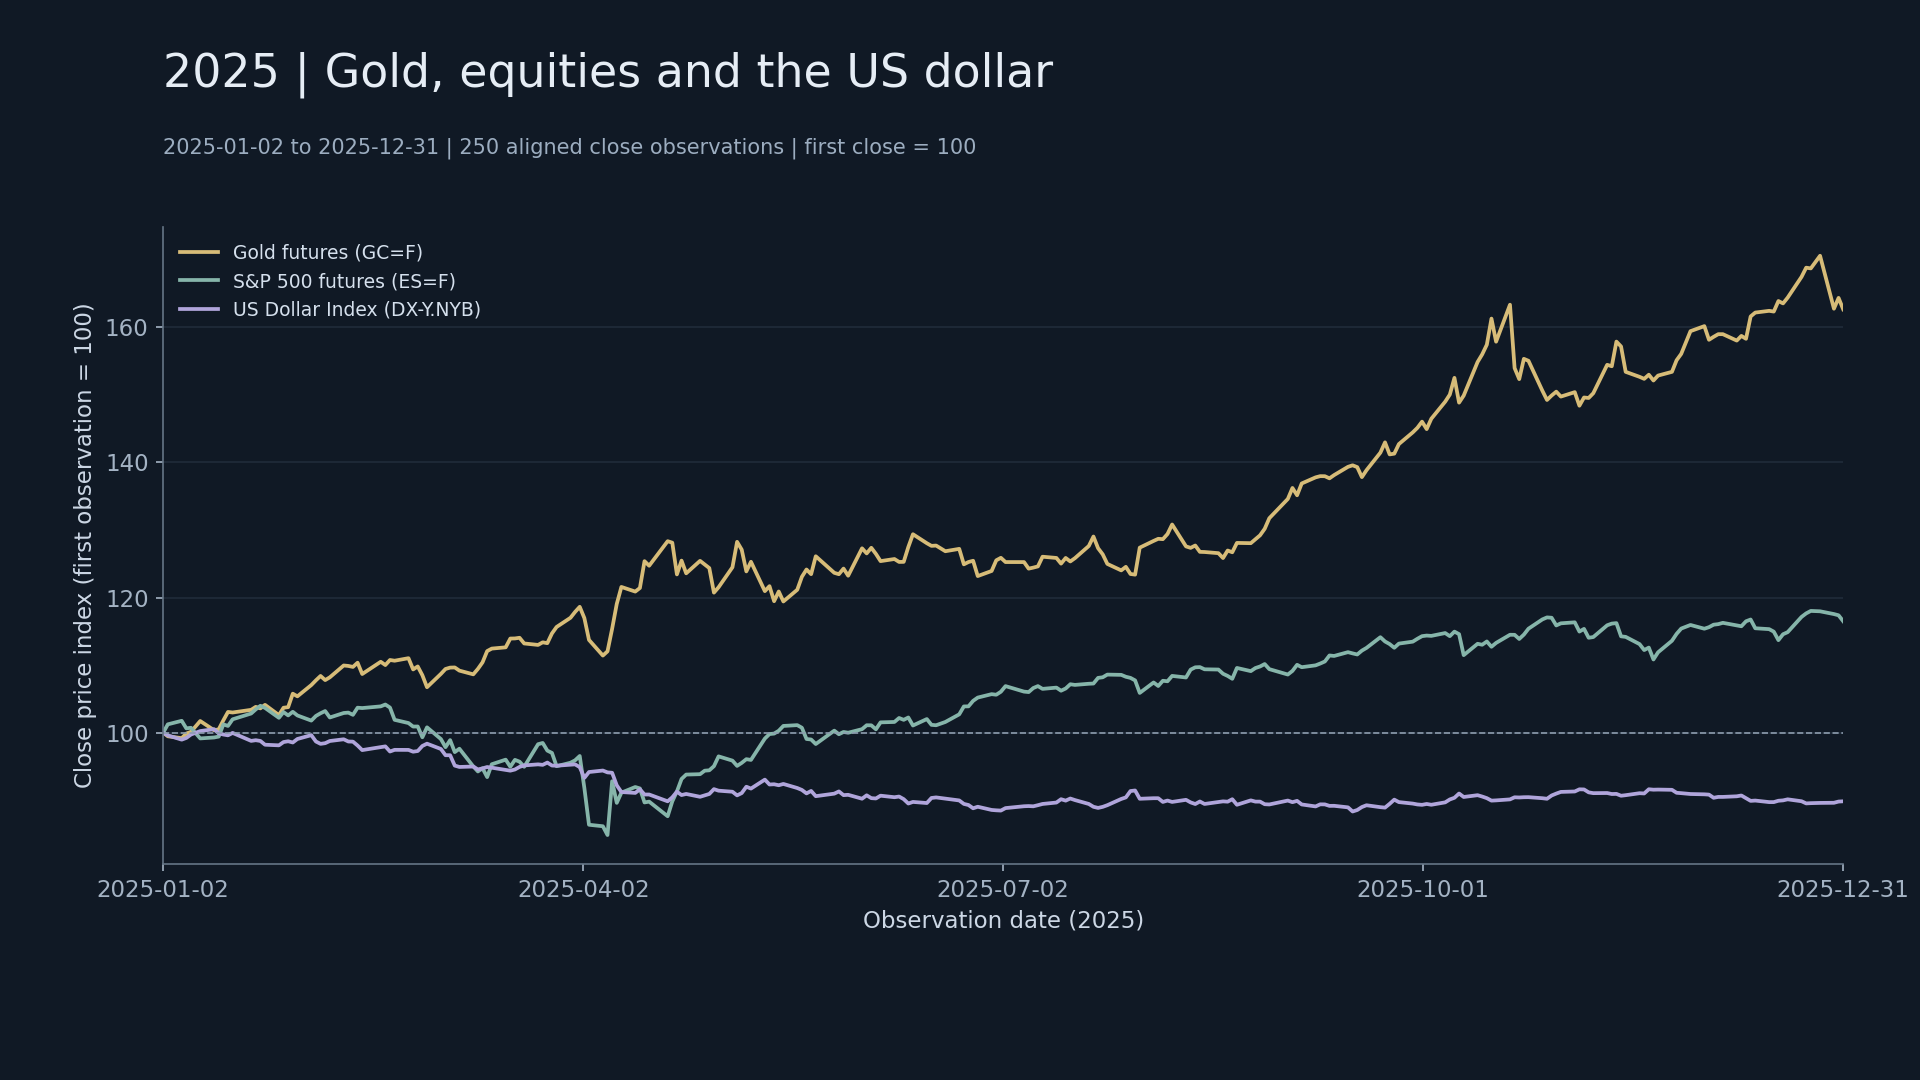
This chart uses actual market data in 2025. The horizontal and vertical coordinates, legend, and date range are listed in the chart.
First check the observation period and unit, and then distinguish the series according to the legend. Yield, price return and drawdown are different indicators. Any dollar amount conclusion also requires actual exposure and costs.
View complete analysis, calculation methodology and download data
This article is a compilation of historical research, Prepared: January 2026.